Assignment 3: Fun with TIMIT, part 1
Due 4/5/2023
Background: Read (skim...) about TIMIT:
Lori Lamel et al., "Speech Database Development: Design and Analysis of the Acoustic-Phonetic Corpus", Speech I/O Assessment and Speech Databases, 1989.
Nattanun Chanchaochai et al. "GlobalTIMIT: Acoustic-Phonetic Datasets for the World's Languages." InterSpeech 2018.
...and check out the Google Scholar citations -- 27,900 in total, and 252 so far in 2023...You can make your own copy from harris.sas.upenn.edu:/plab/timit1/timit1.tgz, which will let you listen to the recordings -- though that's not necessary for this assignment.
Your task (for this assignment): Explore the range of pitches used by the 630 TIMIT speakers in the 6300 TIMIT sentences.
- Copy the file harris.sas.upenn.edu:/plab/timit1/AllF0Quantiles.txt to your own computer (or copy it to your own directory on harris). It consists of 6300 lines, one for each TIMIT sentence.
- Read the file into R, via
X=read.table("AllF0Quantiles.txt")
- Each row has 20 columns. The first one is the file name, and the following 19 are the f0 quantiles in Hz, corresponding to the 19 quantiles from 0.05 to 0.95. Thus the median value will be in column 1+10=11.
- Make a histogram of f0 medians, using the R hist() command, with (say) 100 bins.
- Use the R density() command to make (and plot) a smoothed histogram.
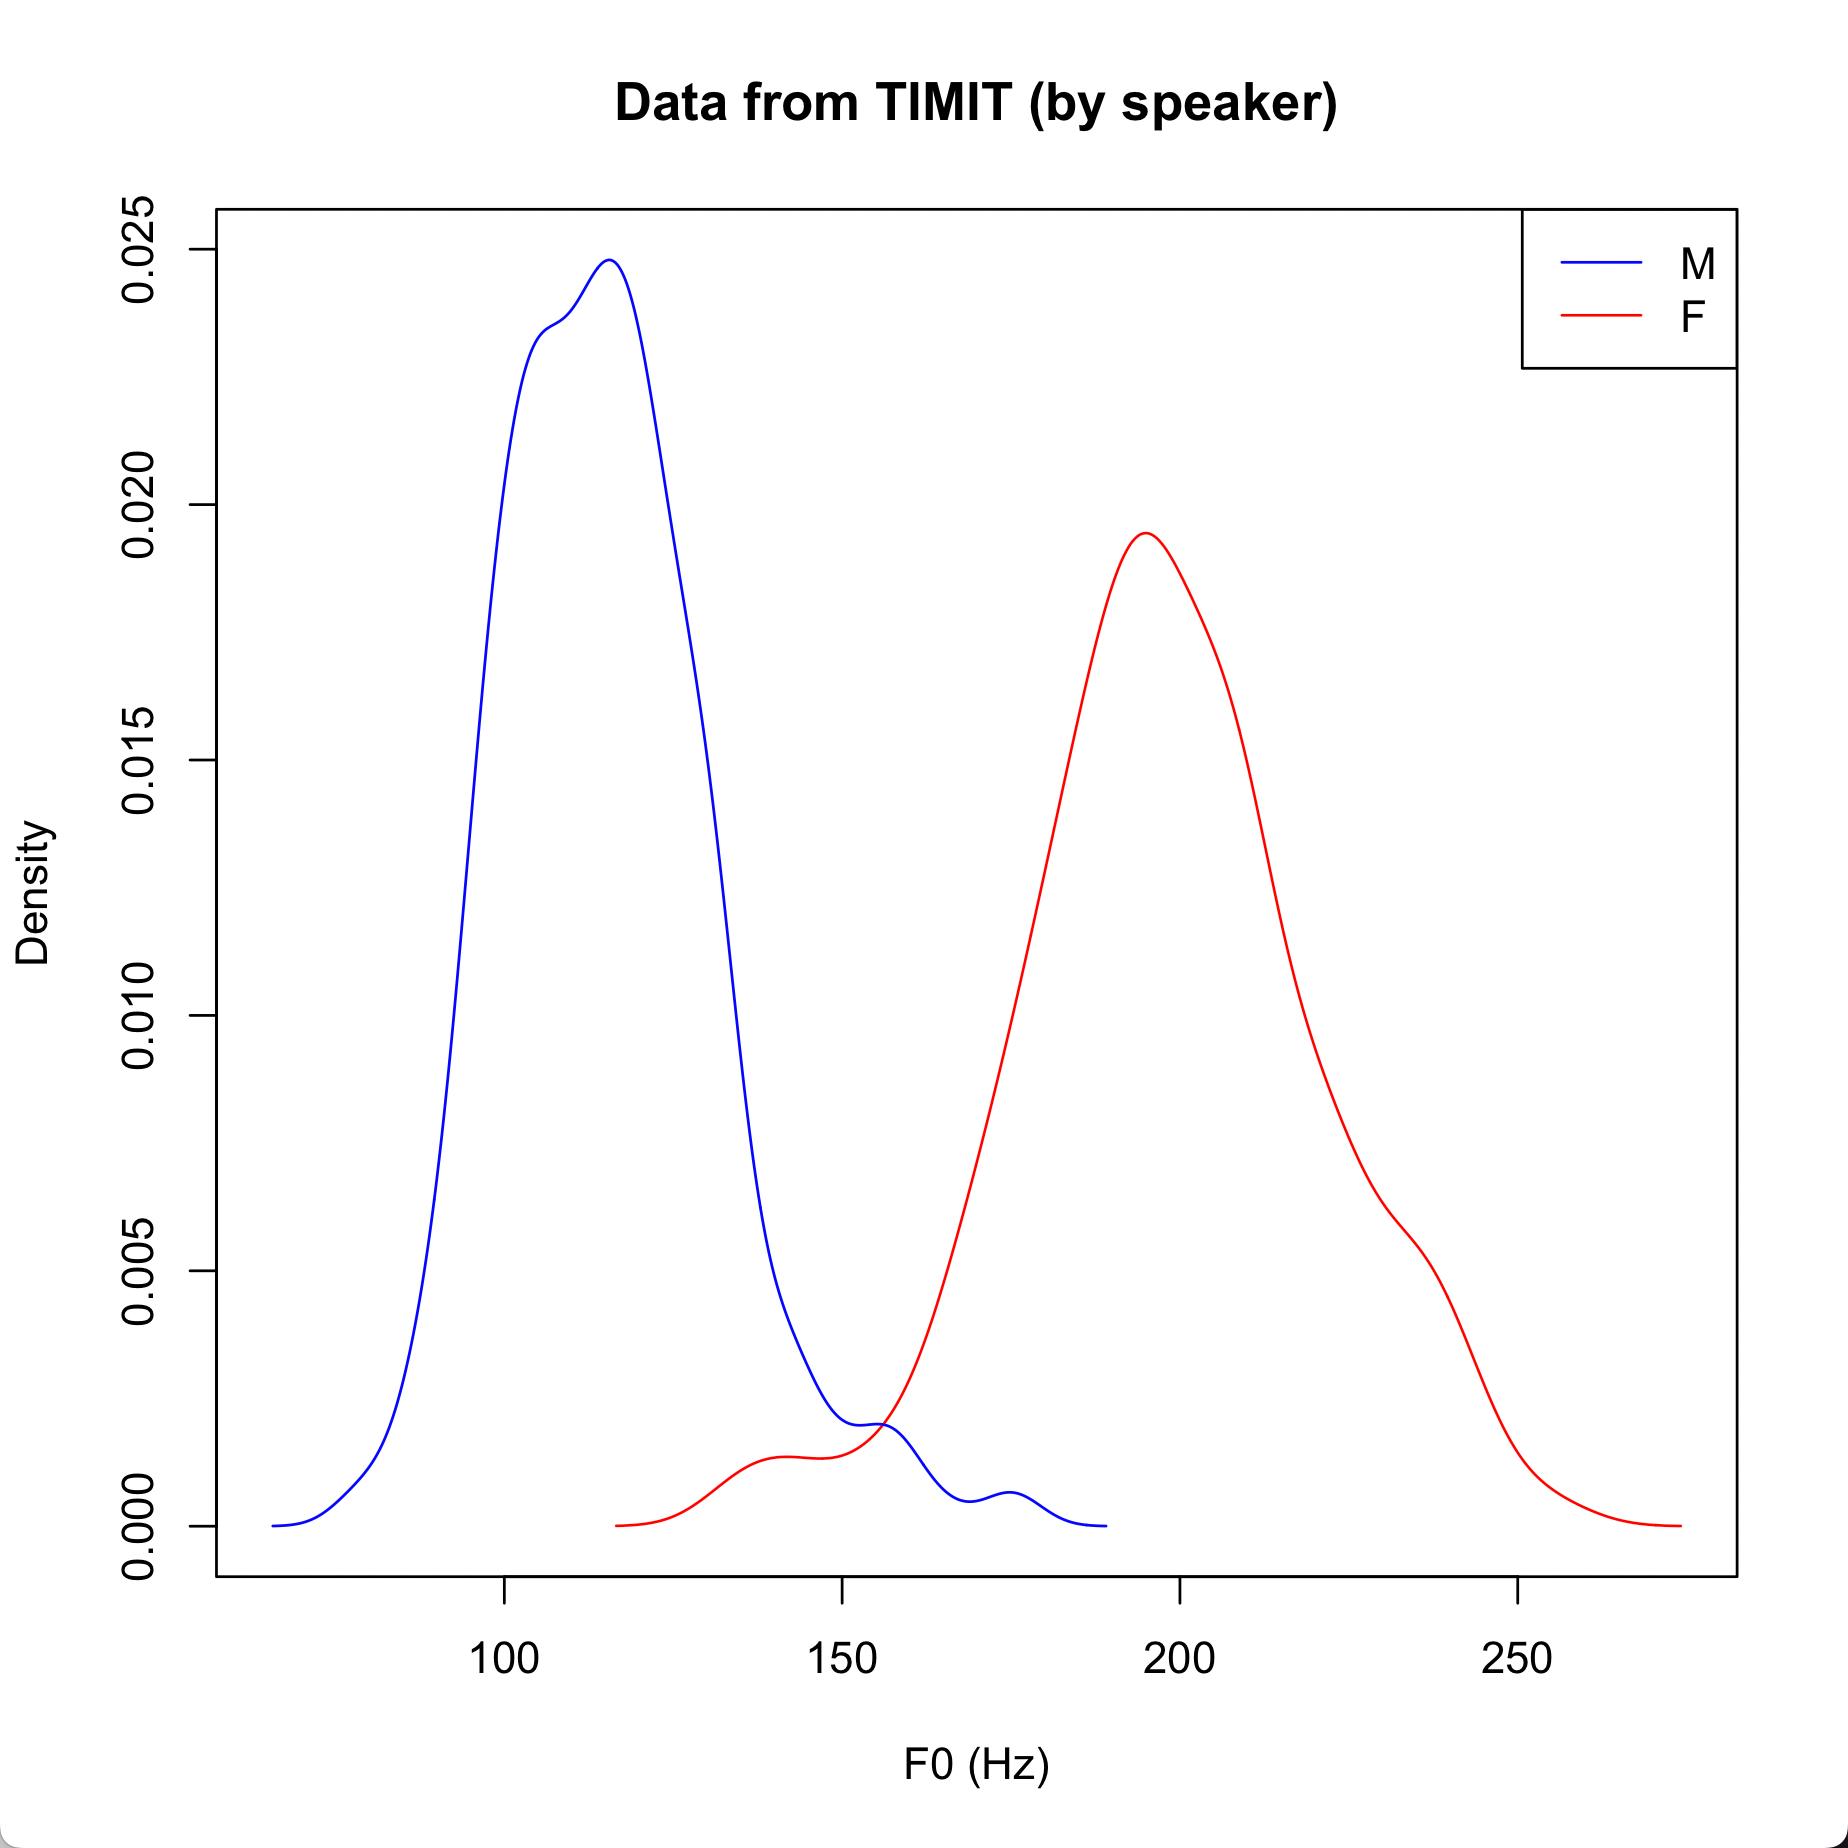
- Rows 1:1920 have file names starting with the letter 'F', meaning that the speaker was identified as female. Rows 1921:6300 have file names starting with the letter 'M', meaning that the speaker was identified as male. Divide the median f0 values into two sets, one for each gender; calculate the density functions, and plot them with different colors.
(Note that differences in vocal effort for a given speaker can create a pitch-range difference much larger than this: for more, see "MLK day: Pitch range", 1/16/2017.) - For each file, calculate the difference in Hz between the 95th percentile and the 5th percentile. Make a histogram and a density plot for these.
- Convert the ranges to semitones -- two pitches p1 and p2 in Hz are 12*log2(p2/p1) semitones apart. Make the same plots using those numbers.
- Why do you think there is such a long tail of very wide ranges? (And it can be worse...) Is there a problem? What could you do to correct it? (For some perspective on what's happening, see "Pitch contour perception", 8/28/2017; and/or "Vocal creak and fry, exemplified", 2/7/2015; or Inka Wilden et al., "Subharmonics, biphonation, and deterministic chaos in mammal vocalization", Bioacoustics 1998...)
- Try the same plots using the 10th and 90th percentiles, or 15th and 85th percentiles. Are the plots any more sensible? If so, why?
Update:
harris.sas.upenn.edu:/plab/timit1/AllSpeakerF0Quantiles.txt
now has f0 quantiles by speaker rather than by sentence, so that you can make a plot like this one if you want: