Distribution of Speech & Silence Durations (4)
Linguistics 521 Exercise #5: First-order analysis of Cookie Theft recordings
As I explained last week, I won't be in class on Monday or Wednesday -- but you should meet anyhow, and work together to
- Extract and plot the distribution of speech and silence durations by diagnostic category from each participant's .trs files; and
- Compare the results of the transcript-alignments of other class members.
Detailed instructions are below -- in effect these class sessions should be Corpus Phonetics hackathons.
You've previously created and checked (in Transcriber) the alignments of the 16 sample Cookie Theft recordings, which you will have saved in files Cookie1.trs, Cookie2.trs, ..., Cookie16.trs. Copy the latest versions of those files to some convenient directory on harris, e.g. /home/YOURID/Cookie or /home/YOURID/ling521/Cookie or whatever.
[If you've used some other file names, such as Cookie4a.trs, you should regularize them, or else you'll need to modify the scripts described below.]
Extracting speech and silence data by diagnostic category
The sample data corresponds to the following diagnostic categories:
# lvPPA Cookie1
# lvPPA Cookie2
# lvPPA Cookie3
# lvPPA Cookie4
#
# prodromal Cookie5
# prodromal Cookie6
# prodromal Cookie7
# prodromal Cookie8
#
# bvFTD Cookie9
# bvFTD Cookie10
# bvFTD Cookie11
# bvFTD Cookie12
#
# svPPA Cookie13
# svPPA Cookie14
# svPPA Cookie15
# svPPA Cookie16
So we write a simple shell script to gather up the speech and silence durations by category. I've written the script below to gather up the durations from nattanun's .trs files -- you should modify the script for different scribes and the locations of their files:
#!/bin/sh
USER=nattanun
LOC=/home/$USER/AlignTest/Cookie
for f in Cookie1 Cookie2 Cookie3 Cookie4
do
    trs2lab $LOC/$f.trs
done >"$USER"_lvPPA
#
for f in Cookie5 Cookie6 Cookie7 Cookie8
do
    trs2lab $LOC/$f.trs
done >"$USER"_prodromal
#
for f in Cookie9 Cookie10 Cookie11 Cookie12
do
    trs2lab $LOC/$f.trs
done >"$USER"_bvFTD
#
for f in Cookie13 Cookie14 Cookie15 Cookie16
do
    trs2lab $LOC/$f.trs
done >"$USER"_svPPA
#
You can get a copy of this script from
harris.sas.upenn.edu:/home/myl/AlignTest/DoCookie1.sh
If you run a copy of this script in some convenient directory in your space on harris, via the command
sh DoCookie1.sh
it should create four files:
nattanun_lvPPA
nattanun_prodromal
nattanun_bvFTD
nattann_svPPA
Each of them should contain a set of lines of the form STARTTIME ENDTIME TYPE, like these:
8.537 10.072 spch
10.072 10.938 nonspch
10.938 11.892 spch
11.892 13.14 nonspch
13.14 14.23 spch
14.23 14.429 nonspch
14.429 16.337 spch
16.337 17.927 nonspch
17.927 21.417 spch
21.417 22.347 nonspch
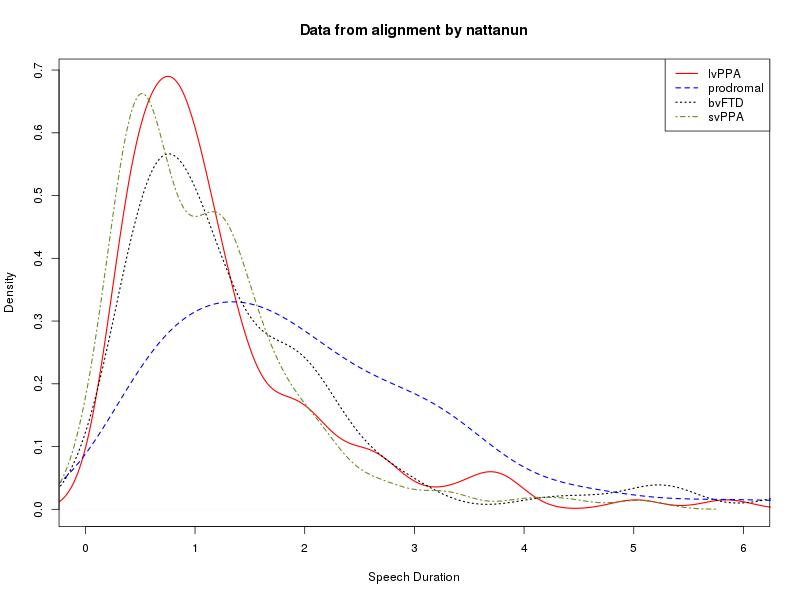
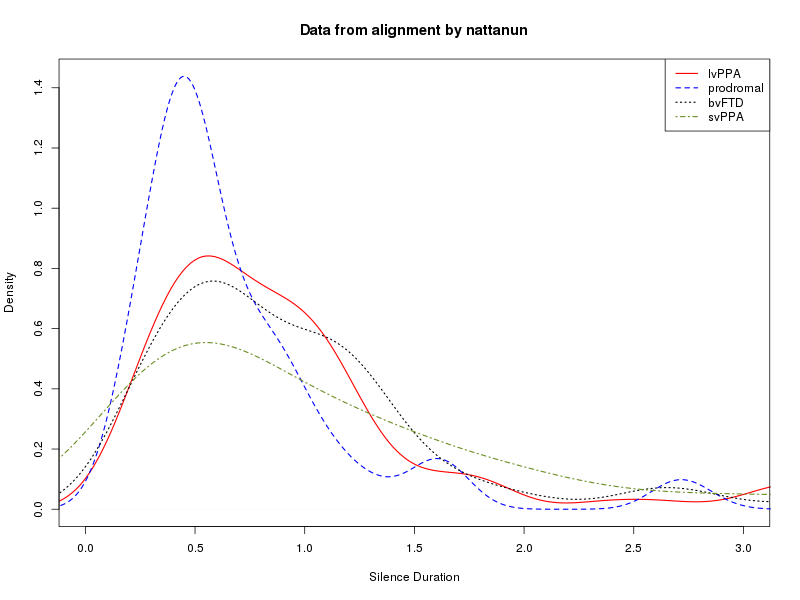
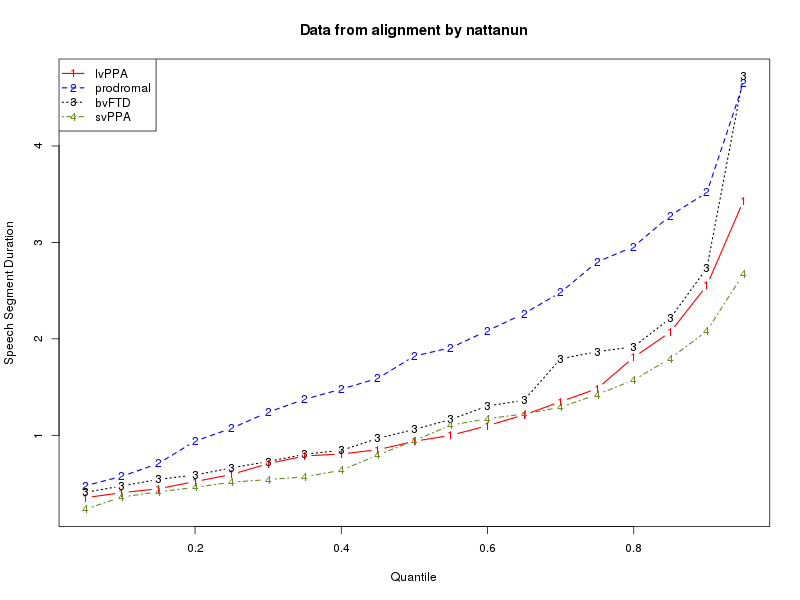
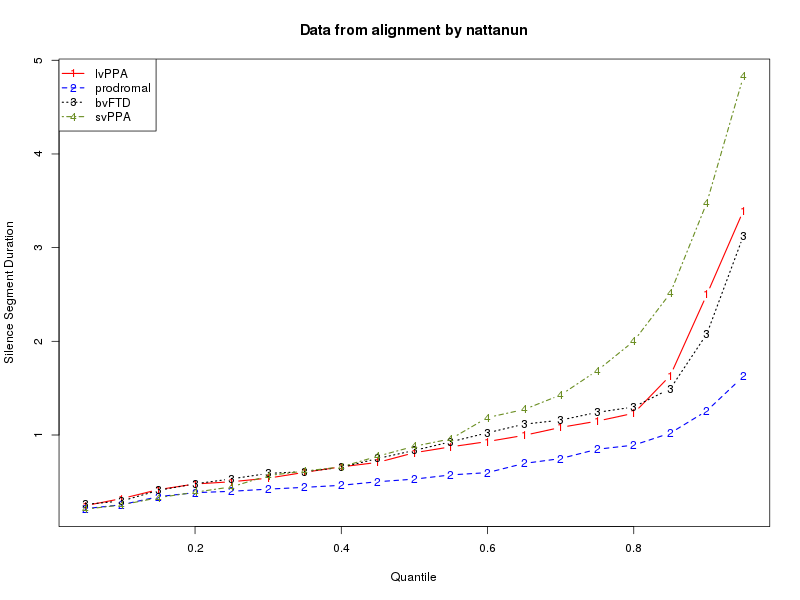
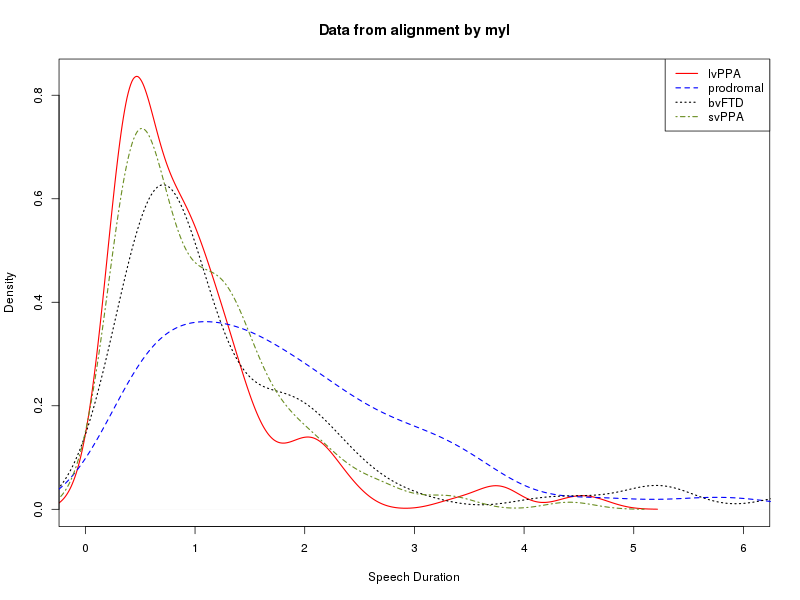
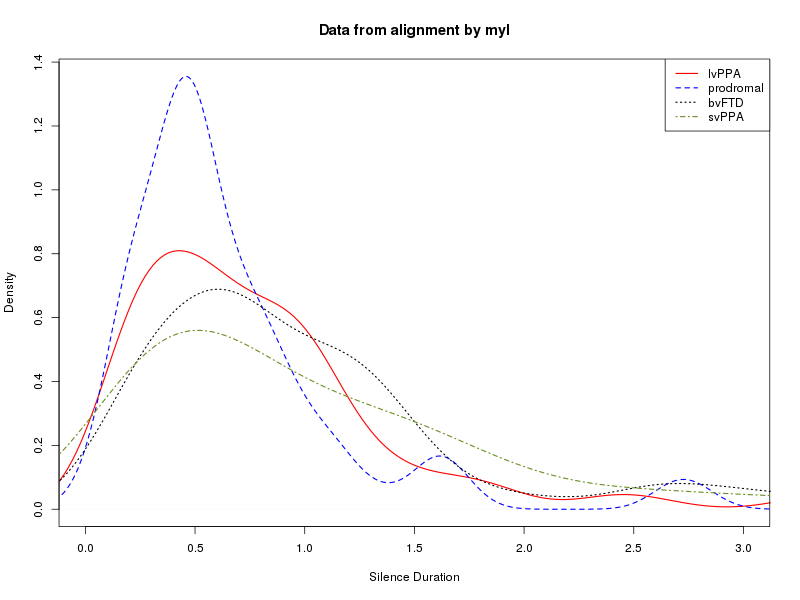
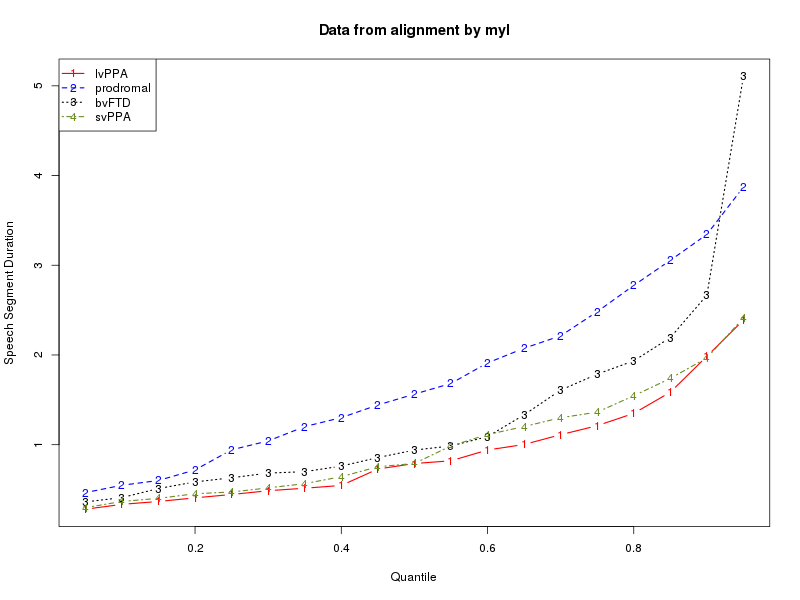
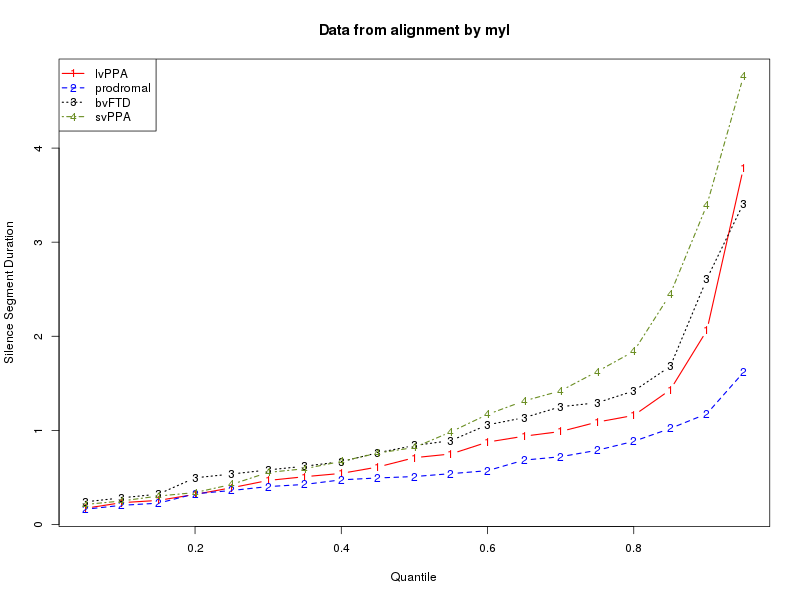
We can read these into R, turn them into lists of speech-segment durations and silence-segment durations for each diagnostic category, and then analyze the results in various ways. Two obvious things to compare are "kernel density plots" and plots of quantiles. The script in
harris.sas.upenn.edu:/home/myl/AlignTest/Cookie/DoCookie1.R
will do this, supposing that you have previously run DoCookie1.sh in the same directory.
The result will be four .png graphics files,
nattanunCookiePlots1.png
nattanunCookiePlots2.png
nattanunCookiePlots3.png
nattanunCookiePlots4.png
which will look like this:
Your tasks in class on Monday and Wednesday are to make sure that your own Cookie Theft .trs files produce sensible graphical output -- by modifying and running DoCookie1.sh and DoCookie1.R, to produce your own data files and graphics files -- and to compare your results to those of other participants.
You'll want to change the USER and LOC variables in DoCookie1.sh, so that it will read your own .trs files, and will create output files named YOURID_lvPPA etc.; and you'll want to make analogous changes in DoCookie1.R.
Here are the plots that result for my alignments:
During the class sessions, work together to share expertise and insights about shell scripts and R scripts, categories of neurodegenerative disorders, and exploratory data analysis.
Next week, we'll explore how to evaluate the statistical significance of such results, how to use such results for classification, and how to start adding other features, such as the distribution of fundamental frequency estimates.
If you have an easy time with this week's tasks, you might start exploring how to use the "bootstrap" technique to estimate confidence intervals for e.g. quantile values. There are R tutorials on the technique here and here.
You might also spend some time generating (and even testing) other hypotheses about what to measure and how to analyze the measurements. For example, here are the basic overall statistics for myl's measurements of the 16 sample descriptions, combined by diagnostic category:
          nspeech dspeech nsilence dsilence mspeech msilence spsilratio
lvPPA         135  134.87      128   133.58    1.00     1.04       1.01
prodromal     108  197.92      100    66.00    1.83     0.66       3.00
bvFTD          82  118.39       62    72.94    1.44     1.18       1.62
svPPA         129  134.70      109   151.26    1.04     1.39       0.89
The meaning of the column labels:
"nspeech" - the total number of speech segments
"dspeech" - the total duration of speech segments (in seconds)
"nsilence" - the total number of silence segments
"dsilence" - the total duration of silence segments (in seconds)
"mspeech" - the mean duration of speech segments (in seconds)
"msilence" - the mean duration of silence segments (in seconds)
"spsilratio" - the ratio of summed speech segment durations to summed silence segment durations
A sample of 4 in each category is not nearly enough to draw conclusions, but this certainly tends to confirm the impression that there will be a useful signal even in this maximally simple-minded characterization of a maximally simple-minded measurement.